


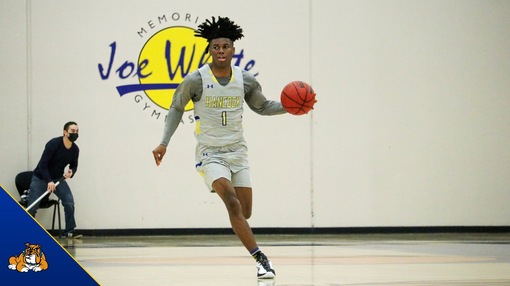
1 Bryce Craver
-
- Height:
- 6'4
-
- Weight:
- 180
-
- Year:
- So.
-
- Hometown:
- La Mirada, CA
-
- High School:
- Veritas Prep
-
- gp
- 23
-
- pts/g
- 6.5
-
- fg %
- 35.5
-
- 3pt %
- 23.8
-
- ft %
- 56.2
-
- reb/g
- 6.8
-
- a/g
- 6.6
Bio
2020-21: Redshirt
2019-20: Saw action in 24 games and averaged 17.7 minutes per game as a freshman... Averaged 7.3 points, 4.5 rebounds, and 2.9 assists per game... Posted a career-high of 16 points in the road victory over Oxnard (2/8)
High School: Was a member of the varsity squad at Veritas Prep High School... Was a Second Team All-League selection and earned the Newcomer of the Year award
Personal: Majoring in Communications... Father (Aaron Craver) spent eight seasons playing in the NFL
Player Profile
| Overall | Conf | |||
|---|---|---|---|---|
| Games | 23 | 12 | ||
| Games started | 23 | 12 | ||
| Minutes | 676 | 353 | ||
| Minutes per game | 29.4 | 29.4 | ||
| FG | 49-138 | 24-68 | ||
| FG Pct | 35.5 | 35.3 | ||
| 3PT | 10-42 | 3-18 | ||
| 3PT Pct | 23.8 | 16.7 | ||
| FT | 41-73 | 17-29 | ||
| FT Pct | 56.2 | 58.6 | ||
| Off rebounds | 31 | 22 | ||
| Def rebounds | 126 | 77 | ||
| Total rebounds | 157 | 99 | ||
| Rebounds per game | 6.8 | 8.3 | ||
| Personal fouls | 43 | 27 | ||
| Disqualifications | - | - | ||
| Assists | 152 | 84 | ||
| Turnovers | 85 | 41 | ||
| Assist to turnover ratio | 1.8 | 2.0 | ||
| Steals | 31 | 11 | ||
| Blocks | 16 | 13 | ||
| Points | 149 | 68 | ||
| Points per game | 6.5 | 5.7 | ||
| Points per 40 min | 8.8 | 7.7 | ||
Game Log - Shooting
| Date | Opponent | Score | gs | min | fg | pct | 3pt | pct | ft | pct | pts |
|---|---|---|---|---|---|---|---|---|---|---|---|
| Sep 17 | vs. TBD | - | - | - | - | - | - | - | - | - | |
| Sep 18 | vs. TBD | - | - | - | - | - | - | - | - | - | |
| Sep 19 | vs. TBD | - | - | - | - | - | - | - | - | - | |
| Oct 15 | at Canyons | - | - | - | - | - | - | - | - | - | |
| Oct 25 | at San Jose | - | - | - | - | - | - | - | - | - | |
| Nov 2 | at Porterville | L, 78-76 | 1 | 20 | 0-2 | 0.0 | 0-0 | - | 0-2 | 0.0 | 0 |
| Nov 6 | at Hartnell | W, 78-71 | 1 | 29 | 2-5 | 40.0 | 0-0 | - | 5-9 | 55.6 | 9 |
| Nov 12 | vs. College of the Sequoias | L, 70-63 | 1 | 30 | 2-6 | 33.3 | 0-2 | 0.0 | 5-6 | 83.3 | 9 |
| Nov 13 | vs. Gavilan | W, 69-64 | 1 | 33 | 2-9 | 22.2 | 0-3 | 0.0 | 2-2 | 100.0 | 6 |
| Nov 19 | Victor Valley | W, 84-52 | 1 | 15 | 4-5 | 80.0 | 0-1 | 0.0 | 2-2 | 100.0 | 10 |
| Nov 20 | LA Trade Tech | W, 72-67 | 1 | 27 | 1-3 | 33.3 | 0-0 | - | 3-5 | 60.0 | 5 |
| Nov 21 | Fresno | L, 71-65 | 1 | 37 | 4-16 | 25.0 | 3-11 | 27.3 | 0-2 | 0.0 | 11 |
| Nov 24 | Cerritos | L, 75-69 | 1 | 36 | 2-6 | 33.3 | 1-2 | 50.0 | 1-1 | 100.0 | 6 |
| Dec 3 | at West Hills Lemoore | W, 78-71 | 1 | 32 | 3-7 | 42.9 | 1-3 | 33.3 | 1-3 | 33.3 | 8 |
| Dec 11 | Santa Monica | W, 84-79 | 1 | 34 | 2-5 | 40.0 | 1-1 | 100.0 | 2-6 | 33.3 | 7 |
| Dec 16 | at San Jose | L, 69-53 | 1 | 30 | 3-6 | 50.0 | 1-1 | 100.0 | 3-6 | 50.0 | 10 |
| Dec 17 | vs. De Anza | W, 73-64 | - | - | - | - | - | - | - | - | - |
| Dec 18 | vs. Hartnell | L, 58-49 | - | - | - | - | - | - | - | - | - |
| Dec 28 | Ohlone | W, 104-67 | - | - | - | - | - | - | - | - | - |
| Dec 29 | Porterville | L, 90-73 | - | - | - | - | - | - | - | - | - |
| Jan 17 | Moorpark | L, 72-68 | 1 | 32 | 3-8 | 37.5 | 1-3 | 33.3 | 1-1 | 100.0 | 8 |
| Jan 19 | Santa Barbara | W, 84-83 | 1 | 30 | 4-5 | 80.0 | 0-0 | - | 1-4 | 25.0 | 9 |
| Jan 26 | at L.A. Pierce | W, 60-52 | 1 | 32 | 0-4 | 0.0 | 0-0 | - | 1-2 | 50.0 | 1 |
| Feb 5 | Oxnard | W, 100-78 | 1 | 35 | 3-7 | 42.9 | 0-0 | - | 2-2 | 100.0 | 8 |
| Feb 7 | Cuesta | W, 66-51 | 1 | 36 | 1-5 | 20.0 | 0-0 | - | 0-0 | - | 2 |
| Feb 9 | at Cuesta | W, 86-70 | 1 | 31 | 0-2 | 0.0 | 0-1 | 0.0 | 1-2 | 50.0 | 1 |
| Feb 12 | at Santa Barbara | W, 106-77 | 1 | 31 | 4-9 | 44.4 | 1-5 | 20.0 | 6-8 | 75.0 | 15 |
| Feb 14 | at Moorpark | W, 85-77 | 1 | 29 | 2-4 | 50.0 | 0-1 | 0.0 | 0-0 | - | 4 |
| Feb 18 | L.A. Pierce | W, 83-72 | 1 | 33 | 1-4 | 25.0 | 0-1 | 0.0 | 1-2 | 50.0 | 3 |
| Feb 21 | at Ventura | L, 86-70 | 1 | 34 | 1-6 | 16.7 | 0-2 | 0.0 | 2-6 | 33.3 | 4 |
| Feb 22 | Chabot | - | - | - | - | - | - | - | - | - | |
| Feb 23 | at Oxnard | W, 97-86 | 1 | 1 | 3-7 | 42.9 | 1-3 | 33.3 | 0-0 | - | 7 |
| Feb 25 | Ventura | L, 72-59 | 1 | 29 | 2-7 | 28.6 | 0-2 | 0.0 | 2-2 | 100.0 | 6 |
Game Log - Ball control
| Date | Opponent | Score | gs | min | off | def | reb | ast | to | a/to | stl | blk | pf | dq |
|---|---|---|---|---|---|---|---|---|---|---|---|---|---|---|
| Sep 17 | vs. TBD | - | - | - | - | - | - | - | - | - | - | - | - | |
| Sep 18 | vs. TBD | - | - | - | - | - | - | - | - | - | - | - | - | |
| Sep 19 | vs. TBD | - | - | - | - | - | - | - | - | - | - | - | - | |
| Oct 15 | at Canyons | - | - | - | - | - | - | - | - | - | - | - | - | |
| Oct 25 | at San Jose | - | - | - | - | - | - | - | - | - | - | - | - | |
| Nov 2 | at Porterville | L, 78-76 | 1 | 20 | 0 | 2 | 2 | 4 | 4 | 1.0 | 0 | 0 | 0 | - |
| Nov 6 | at Hartnell | W, 78-71 | 1 | 29 | 0 | 1 | 1 | 7 | 3 | 2.3 | 2 | 1 | 2 | - |
| Nov 12 | vs. College of the Sequoias | L, 70-63 | 1 | 30 | 1 | 2 | 3 | 8 | 5 | 1.6 | 2 | 0 | 0 | - |
| Nov 13 | vs. Gavilan | W, 69-64 | 1 | 33 | 1 | 6 | 7 | 5 | 3 | 1.7 | 1 | 1 | 0 | - |
| Nov 19 | Victor Valley | W, 84-52 | 1 | 15 | 0 | 3 | 3 | 5 | 2 | 2.5 | 7 | 1 | 1 | - |
| Nov 20 | LA Trade Tech | W, 72-67 | 1 | 27 | 2 | 5 | 7 | 6 | 6 | 1.0 | 4 | 0 | 4 | - |
| Nov 21 | Fresno | L, 71-65 | 1 | 37 | 2 | 10 | 12 | 5 | 6 | 0.8 | 2 | 0 | 1 | - |
| Nov 24 | Cerritos | L, 75-69 | 1 | 36 | 0 | 3 | 3 | 6 | 2 | 3.0 | 0 | 0 | 3 | - |
| Dec 3 | at West Hills Lemoore | W, 78-71 | 1 | 32 | 1 | 8 | 9 | 7 | 2 | 3.5 | 0 | 0 | 0 | - |
| Dec 11 | Santa Monica | W, 84-79 | 1 | 34 | 1 | 7 | 8 | 11 | 2 | 5.5 | 1 | 0 | 3 | - |
| Dec 16 | at San Jose | L, 69-53 | 1 | 30 | 1 | 2 | 3 | 4 | 9 | 0.4 | 1 | 0 | 2 | - |
| Dec 17 | vs. De Anza | W, 73-64 | - | - | - | - | - | - | - | - | - | - | - | - |
| Dec 18 | vs. Hartnell | L, 58-49 | - | - | - | - | - | - | - | - | - | - | - | - |
| Dec 28 | Ohlone | W, 104-67 | - | - | - | - | - | - | - | - | - | - | - | - |
| Dec 29 | Porterville | L, 90-73 | - | - | - | - | - | - | - | - | - | - | - | - |
| Jan 17 | Moorpark | L, 72-68 | 1 | 32 | 1 | 5 | 6 | 4 | 0 | - | 2 | 0 | 3 | - |
| Jan 19 | Santa Barbara | W, 84-83 | 1 | 30 | 4 | 7 | 11 | 4 | 3 | 1.3 | 1 | 1 | 2 | - |
| Jan 26 | at L.A. Pierce | W, 60-52 | 1 | 32 | 2 | 7 | 9 | 6 | 3 | 2.0 | 1 | 3 | 2 | - |
| Feb 5 | Oxnard | W, 100-78 | 1 | 35 | 2 | 6 | 8 | 7 | 4 | 1.8 | 2 | 2 | 4 | - |
| Feb 7 | Cuesta | W, 66-51 | 1 | 36 | 4 | 8 | 12 | 7 | 3 | 2.3 | 0 | 1 | 1 | - |
| Feb 9 | at Cuesta | W, 86-70 | 1 | 31 | 2 | 12 | 14 | 15 | 4 | 3.8 | 0 | 1 | 2 | - |
| Feb 12 | at Santa Barbara | W, 106-77 | 1 | 31 | 0 | 9 | 9 | 7 | 2 | 3.5 | 0 | 0 | 2 | - |
| Feb 14 | at Moorpark | W, 85-77 | 1 | 29 | 0 | 8 | 8 | 13 | 6 | 2.2 | 2 | 0 | 0 | - |
| Feb 18 | L.A. Pierce | W, 83-72 | 1 | 33 | 1 | 3 | 4 | 7 | 6 | 1.2 | 0 | 3 | 4 | - |
| Feb 21 | at Ventura | L, 86-70 | 1 | 34 | 5 | 3 | 8 | 3 | 2 | 1.5 | 0 | 0 | 2 | - |
| Feb 22 | Chabot | - | - | - | - | - | - | - | - | - | - | - | - | |
| Feb 23 | at Oxnard | W, 97-86 | 1 | 1 | 1 | 5 | 6 | 9 | 2 | 4.5 | 1 | 0 | 3 | - |
| Feb 25 | Ventura | L, 72-59 | 1 | 29 | 0 | 4 | 4 | 2 | 6 | 0.3 | 2 | 2 | 2 | - |
Career Stats - Shooting per game
Career Stats - Shooting per 40 min
Career Stats - Ball control per game
Career Stats - Ball control per 40 min
| gp | gs | mpg | off/40 | def/40 | reb/40 | pf/40 | dq/40 | ast/40 | to/40 | a/to | stl/40 | blk/40 | |
|---|---|---|---|---|---|---|---|---|---|---|---|---|---|
| 2019-20 | 24 | 10 | 17.7 | 2.5 | 7.8 | 10.3 | 3.9 | 0.0 | 6.5 | 4.2 | 1.5 | 3.1 | 0.3 |
| 2020-21 | 1 | 1 | 31.0 | 6.5 | 2.6 | 9.0 | 2.6 | 0.0 | 6.5 | 5.2 | 1.3 | 0.0 | 0.0 |
| 2021-22 | 23 | 23 | 29.4 | 1.8 | 7.5 | 9.3 | 2.5 | 0.0 | 9.0 | 5.0 | 1.8 | 1.8 | 0.9 |
| Total | 48 | 34 | 23.6 | 2.2 | 7.5 | 9.7 | 3.0 | 0.0 | 8.0 | 4.7 | 1.7 | 2.3 | 0.7 |
Splits Stats - Shooting per game
| gp | gs | min/g | fg/g | pct | 3pt/g | pct | ft/g | pct | ppg | ||
|---|---|---|---|---|---|---|---|---|---|---|---|
| Event | Total | 23 | 23 | 29.4 | 2.1-6.0 | 35.5 | 0.4-1.8 | 23.8 | 1.8-3.2 | 56.2 | 6.5 |
| Conference | 12 | 12 | 29.4 | 2.0-5.7 | 35.3 | 0.2-1.5 | 16.7 | 1.4-2.4 | 58.6 | 5.7 | |
| Exhibition | - | - | - | 0.0-0.0 | - | 0.0-0.0 | - | 0.0-0.0 | - | - | |
| Location | Home | 11 | 11 | 31.3 | 2.5-6.5 | 38.0 | 0.5-1.9 | 28.6 | 1.4-2.5 | 55.6 | 6.8 |
| Away | 10 | 10 | 26.9 | 1.8-5.2 | 34.6 | 0.4-1.6 | 25.0 | 1.9-3.8 | 50.0 | 5.9 | |
| Neutral | 2 | 2 | 31.5 | 2.0-7.5 | 26.7 | 0.0-2.5 | 0.0 | 3.5-4.0 | 87.5 | 7.5 | |
| Result | Wins | 15 | 15 | 28.5 | 2.1-5.4 | 39.5 | 0.3-1.3 | 21.1 | 1.8-3.1 | 57.4 | 6.3 |
| Losses | 8 | 8 | 31.0 | 2.1-7.1 | 29.8 | 0.8-2.9 | 26.1 | 1.8-3.2 | 53.8 | 6.8 | |
| Month | November | 8 | 8 | 28.4 | 2.1-6.5 | 32.7 | 0.5-2.4 | 21.1 | 2.2-3.6 | 62.1 | 7.0 |
| December | 3 | 3 | 32.0 | 2.7-6.0 | 44.4 | 1.0-1.7 | 60.0 | 2.0-5.0 | 40.0 | 8.3 | |
| January | 3 | 3 | 31.3 | 2.3-5.7 | 41.2 | 0.3-1.0 | 33.3 | 1.0-2.3 | 42.9 | 6.0 | |
| February | 9 | 9 | 28.8 | 1.9-5.7 | 33.3 | 0.2-1.7 | 13.3 | 1.6-2.4 | 63.6 | 5.6 |
Splits Stats - Shooting totals
| gp | gs | min | fg | pct | 3pt | pct | ft | pct | pts | ||
|---|---|---|---|---|---|---|---|---|---|---|---|
| Event | Total | 23 | 23 | 676 | 49-138 | 35.5 | 10-42 | 23.8 | 41-73 | 56.2 | 149 |
| Conference | 12 | 12 | 353 | 24-68 | 35.3 | 3-18 | 16.7 | 17-29 | 58.6 | 68 | |
| Exhibition | - | - | - | 0-0 | - | 0-0 | - | 0-0 | - | 0 | |
| Location | Home | 11 | 11 | 344 | 27-71 | 38.0 | 6-21 | 28.6 | 15-27 | 55.6 | 75 |
| Away | 10 | 10 | 269 | 18-52 | 34.6 | 4-16 | 25.0 | 19-38 | 50.0 | 59 | |
| Neutral | 2 | 2 | 63 | 4-15 | 26.7 | 0-5 | 0.0 | 7-8 | 87.5 | 15 | |
| Result | Wins | 15 | 15 | 428 | 32-81 | 39.5 | 4-19 | 21.1 | 27-47 | 57.4 | 95 |
| Losses | 8 | 8 | 248 | 17-57 | 29.8 | 6-23 | 26.1 | 14-26 | 53.8 | 54 | |
| Month | November | 8 | 8 | 227 | 17-52 | 32.7 | 4-19 | 21.1 | 18-29 | 62.1 | 56 |
| December | 3 | 3 | 96 | 8-18 | 44.4 | 3-5 | 60.0 | 6-15 | 40.0 | 25 | |
| January | 3 | 3 | 94 | 7-17 | 41.2 | 1-3 | 33.3 | 3-7 | 42.9 | 18 | |
| February | 9 | 9 | 259 | 17-51 | 33.3 | 2-15 | 13.3 | 14-22 | 63.6 | 50 |
Splits Stats - Shooting per 40 min
| gp | gs | min/g | fg/40 | pct | 3pt/40 | pct | ft/40 | pct | pts/40 | ||
|---|---|---|---|---|---|---|---|---|---|---|---|
| Event | Total | 23 | 23 | 29.4 | 2.9-8.2 | 35.5 | 0.6-2.5 | 23.8 | 2.4-4.3 | 56.2 | 8.8 |
| Conference | 12 | 12 | 29.4 | 2.7-7.7 | 35.3 | 0.3-2.0 | 16.7 | 1.9-3.3 | 58.6 | 7.7 | |
| Exhibition | - | - | - | 0.0-0.0 | - | 0.0-0.0 | - | 0.0-0.0 | - | - | |
| Location | Home | 11 | 11 | 31.3 | 3.1-8.3 | 38.0 | 0.7-2.4 | 28.6 | 1.7-3.1 | 55.6 | 8.7 |
| Away | 10 | 10 | 26.9 | 2.7-7.7 | 34.6 | 0.6-2.4 | 25.0 | 2.8-5.7 | 50.0 | 8.8 | |
| Neutral | 2 | 2 | 31.5 | 2.5-9.5 | 26.7 | 0.0-3.2 | 0.0 | 4.4-5.1 | 87.5 | 9.5 | |
| Result | Wins | 15 | 15 | 28.5 | 3.0-7.6 | 39.5 | 0.4-1.8 | 21.1 | 2.5-4.4 | 57.4 | 8.9 |
| Losses | 8 | 8 | 31.0 | 2.7-9.2 | 29.8 | 1.0-3.7 | 26.1 | 2.3-4.2 | 53.8 | 8.7 | |
| Month | November | 8 | 8 | 28.4 | 3.0-9.2 | 32.7 | 0.7-3.3 | 21.1 | 3.2-5.1 | 62.1 | 9.9 |
| December | 3 | 3 | 32.0 | 3.3-7.5 | 44.4 | 1.2-2.1 | 60.0 | 2.5-6.2 | 40.0 | 10.4 | |
| January | 3 | 3 | 31.3 | 3.0-7.2 | 41.2 | 0.4-1.3 | 33.3 | 1.3-3.0 | 42.9 | 7.7 | |
| February | 9 | 9 | 28.8 | 2.6-7.9 | 33.3 | 0.3-2.3 | 13.3 | 2.2-3.4 | 63.6 | 7.7 |
Splits Stats - Ball control per game
| gp | gs | mpg | off/g | def/g | reb/g | pf/g | dq/g | ast/g | to/g | a/to | stl/g | blk/g | ||
|---|---|---|---|---|---|---|---|---|---|---|---|---|---|---|
| Event | Total | 23 | 23 | 29.4 | 1.3 | 5.5 | 6.8 | 1.9 | - | 6.6 | 3.7 | 1.8 | 1.3 | 0.7 |
| Conference | 12 | 12 | 29.4 | 1.8 | 6.4 | 8.3 | 2.3 | - | 7.0 | 3.4 | 2.0 | 0.9 | 1.1 | |
| Exhibition | - | - | - | - | - | - | - | - | - | - | - | - | - | |
| Location | Home | 11 | 11 | 31.3 | 1.5 | 5.5 | 7.1 | 2.5 | - | 5.8 | 3.6 | 1.6 | 1.9 | 0.9 |
| Away | 10 | 10 | 26.9 | 1.2 | 5.7 | 6.9 | 1.5 | - | 7.5 | 3.7 | 2.0 | 0.7 | 0.5 | |
| Neutral | 2 | 2 | 31.5 | 1.0 | 4.0 | 5.0 | 0.0 | - | 6.5 | 4.0 | 1.6 | 1.5 | 0.5 | |
| Result | Wins | 15 | 15 | 28.5 | 1.4 | 6.3 | 7.7 | 2.0 | - | 7.7 | 3.4 | 2.3 | 1.5 | 0.9 |
| Losses | 8 | 8 | 31.0 | 1.3 | 3.9 | 5.1 | 1.6 | - | 4.5 | 4.3 | 1.1 | 1.1 | 0.3 | |
| Month | November | 8 | 8 | 28.4 | 0.8 | 4.0 | 4.8 | 1.4 | - | 5.8 | 3.9 | 1.5 | 2.3 | 0.4 |
| December | 3 | 3 | 32.0 | 1.0 | 5.7 | 6.7 | 1.7 | - | 7.3 | 4.3 | 1.7 | 0.7 | 0.0 | |
| January | 3 | 3 | 31.3 | 2.3 | 6.3 | 8.7 | 2.3 | - | 4.7 | 2.0 | 2.3 | 1.3 | 1.3 | |
| February | 9 | 9 | 28.8 | 1.7 | 6.4 | 8.1 | 2.2 | - | 7.8 | 3.9 | 2.0 | 0.8 | 1.0 |
Splits Stats - Ball control totals
| gp | gs | min | off | def | reb | pf | dq | ast | to | a/to | stl | blk | ||
|---|---|---|---|---|---|---|---|---|---|---|---|---|---|---|
| Event | Total | 23 | 23 | 676 | 31 | 126 | 157 | 43 | - | 152 | 85 | 1.8 | 31 | 16 |
| Conference | 12 | 12 | 353 | 22 | 77 | 99 | 27 | - | 84 | 41 | 2.0 | 11 | 13 | |
| Exhibition | - | - | - | - | - | - | - | - | - | - | - | - | - | |
| Location | Home | 11 | 11 | 344 | 17 | 61 | 78 | 28 | - | 64 | 40 | 1.6 | 21 | 10 |
| Away | 10 | 10 | 269 | 12 | 57 | 69 | 15 | - | 75 | 37 | 2.0 | 7 | 5 | |
| Neutral | 2 | 2 | 63 | 2 | 8 | 10 | 0 | - | 13 | 8 | 1.6 | 3 | 1 | |
| Result | Wins | 15 | 15 | 428 | 21 | 95 | 116 | 30 | - | 116 | 51 | 2.3 | 22 | 14 |
| Losses | 8 | 8 | 248 | 10 | 31 | 41 | 13 | - | 36 | 34 | 1.1 | 9 | 2 | |
| Month | November | 8 | 8 | 227 | 6 | 32 | 38 | 11 | - | 46 | 31 | 1.5 | 18 | 3 |
| December | 3 | 3 | 96 | 3 | 17 | 20 | 5 | - | 22 | 13 | 1.7 | 2 | 0 | |
| January | 3 | 3 | 94 | 7 | 19 | 26 | 7 | - | 14 | 6 | 2.3 | 4 | 4 | |
| February | 9 | 9 | 259 | 15 | 58 | 73 | 20 | - | 70 | 35 | 2.0 | 7 | 9 |
Splits Stats - Ball control per 40 min
| gp | gs | mpg | off/40 | def/40 | reb/40 | pf/40 | dq/40 | ast/40 | to/40 | a/to | stl/40 | blk/40 | ||
|---|---|---|---|---|---|---|---|---|---|---|---|---|---|---|
| Event | Total | 23 | 23 | 29.4 | 1.8 | 7.5 | 9.3 | 2.5 | 0.0 | 9.0 | 5.0 | 1.8 | 1.8 | 0.9 |
| Conference | 12 | 12 | 29.4 | 2.5 | 8.7 | 11.2 | 3.1 | 0.0 | 9.5 | 4.6 | 2.0 | 1.2 | 1.5 | |
| Exhibition | - | - | - | - | - | - | - | - | - | - | - | - | - | |
| Location | Home | 11 | 11 | 31.3 | 2.0 | 7.1 | 9.1 | 3.3 | 0.0 | 7.4 | 4.7 | 1.6 | 2.4 | 1.2 |
| Away | 10 | 10 | 26.9 | 1.8 | 8.5 | 10.3 | 2.2 | 0.0 | 11.2 | 5.5 | 2.0 | 1.0 | 0.7 | |
| Neutral | 2 | 2 | 31.5 | 1.3 | 5.1 | 6.3 | 0.0 | 0.0 | 8.3 | 5.1 | 1.6 | 1.9 | 0.6 | |
| Result | Wins | 15 | 15 | 28.5 | 2.0 | 8.9 | 10.8 | 2.8 | 0.0 | 10.8 | 4.8 | 2.3 | 2.1 | 1.3 |
| Losses | 8 | 8 | 31.0 | 1.6 | 5.0 | 6.6 | 2.1 | 0.0 | 5.8 | 5.5 | 1.1 | 1.5 | 0.3 | |
| Month | November | 8 | 8 | 28.4 | 1.1 | 5.6 | 6.7 | 1.9 | 0.0 | 8.1 | 5.5 | 1.5 | 3.2 | 0.5 |
| December | 3 | 3 | 32.0 | 1.3 | 7.1 | 8.3 | 2.1 | 0.0 | 9.2 | 5.4 | 1.7 | 0.8 | 0.0 | |
| January | 3 | 3 | 31.3 | 3.0 | 8.1 | 11.1 | 3.0 | 0.0 | 6.0 | 2.6 | 2.3 | 1.7 | 1.7 | |
| February | 9 | 9 | 28.8 | 2.3 | 9.0 | 11.3 | 3.1 | 0.0 | 10.8 | 5.4 | 2.0 | 1.1 | 1.4 |
News Mentions


Five Bulldogs Tabbed as All-Conference Selections
February 28, 2022
Men's Basketball: Win Streak Snapped in 86-70 Loss at Ventura
February 22, 2022

Men's Basketball Extends Streak to Eight with Win over LA Pierce
February 18, 2022
Bulldogs Thump Santa Barbara En Route to Sixth Straight Win
February 13, 2022

Men's Basketball Secures Fifth Straight Win at Cuesta
February 10, 2022
Bulldogs Bounce Cuesta En Route to Four Game Win Streak
February 7, 2022

Bulldogs Return to Action with Win over Oxnard
February 5, 2022

Bulldogs Top Santa Barbara in Overtime Thriller
January 19, 2022
Men's Basketball Falls at Home to Raiders in WSC Showdown
January 18, 2022
Bulldogs Outlast Santa Monica at Home
December 11, 2021

Men's Basketball Bounces Back with Win at West Hills Lemoore
December 6, 2021
Men's Basketball Comeback Effort Falls Short Against Cerritos
November 25, 2021

Bulldogs Split Games at Hinson's Tire Pros Winter Classic
November 15, 2021

Men's Basketball Bounces Back with Win at Hartnell
November 7, 2021
Bulldogs Fall in Season Opener at Porterville
November 3, 2021
Photos


