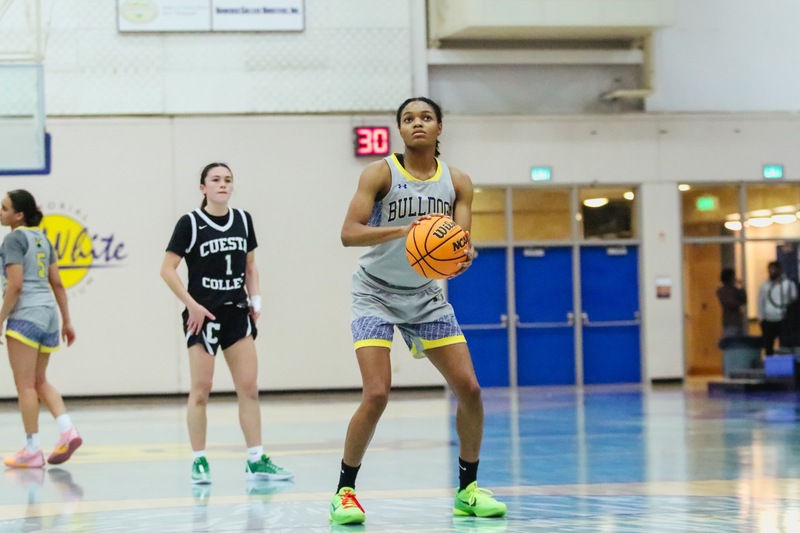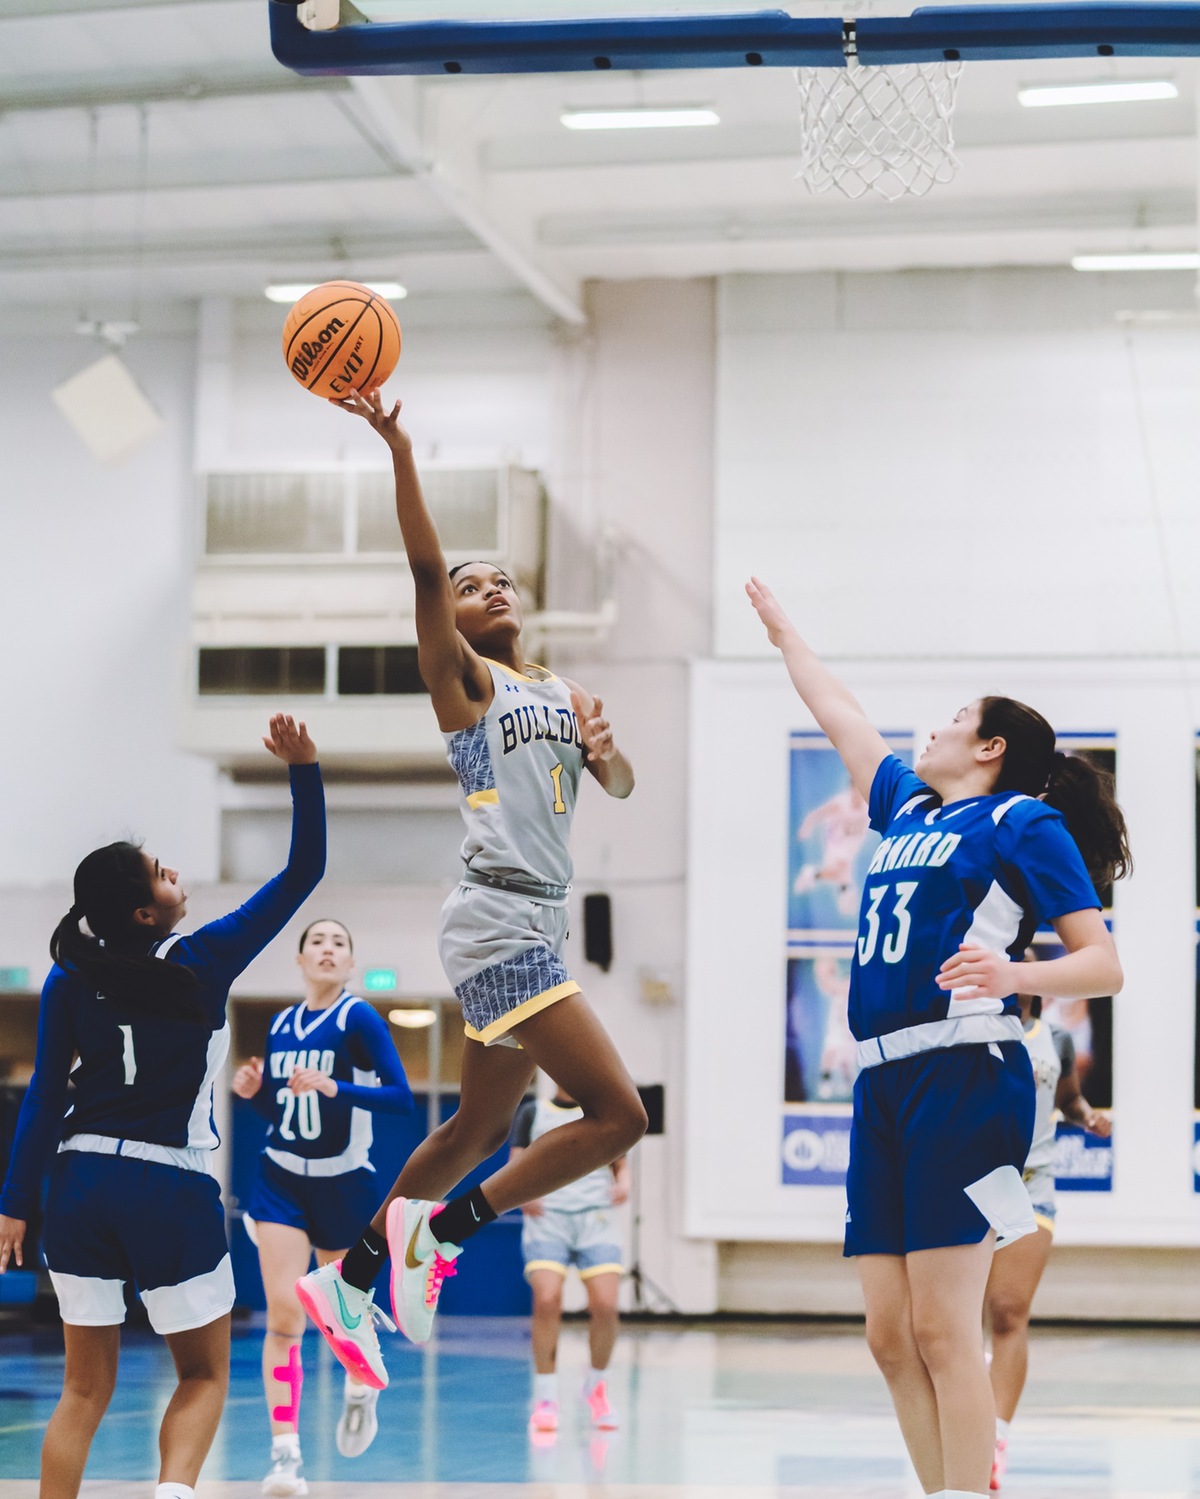

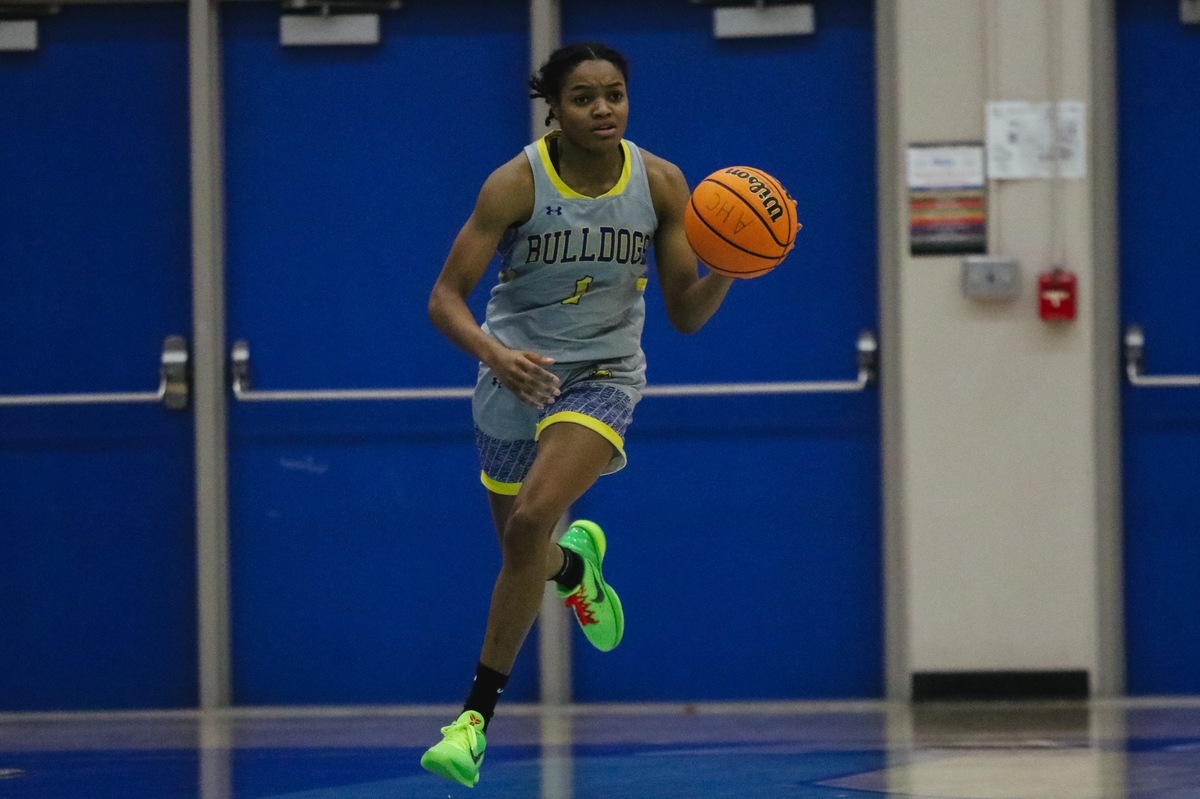

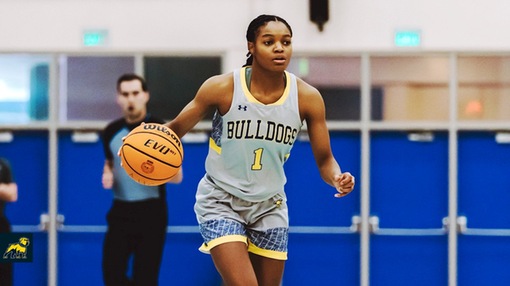
1 India Dowling-Green
-
- Height:
- 5'10
-
- Year:
- So.
-
- Hometown:
- Orangeburg, SC
-
- Position:
- F
-
- gp
- 30
-
- pts/g
- 12.7
-
- fg %
- 41.9
-
- 3pt %
- 25.0
-
- ft %
- 58.2
-
- reb/g
- 8.5
-
- a/g
- 1.1
Player Profile
| Overall | Conf | |||
|---|---|---|---|---|
| Games | 30 | 12 | ||
| Games started | 30 | 12 | ||
| Minutes | 984 | 385 | ||
| Minutes per game | 32.8 | 32.1 | ||
| FG | 134-320 | 47-122 | ||
| FG Pct | 41.9 | 38.5 | ||
| 3PT | 1-4 | 0-2 | ||
| 3PT Pct | 25.0 | 0.0 | ||
| FT | 113-194 | 33-51 | ||
| FT Pct | 58.2 | 64.7 | ||
| Off rebounds | 99 | 46 | ||
| Def rebounds | 155 | 59 | ||
| Total rebounds | 254 | 105 | ||
| Rebounds per game | 8.5 | 8.8 | ||
| Personal fouls | 67 | 29 | ||
| Disqualifications | 1 | - | ||
| Assists | 32 | 15 | ||
| Turnovers | 80 | 28 | ||
| Assist to turnover ratio | 0.4 | 0.5 | ||
| Steals | 40 | 13 | ||
| Blocks | 4 | 2 | ||
| Points | 382 | 127 | ||
| Points per game | 12.7 | 10.6 | ||
| Points per 40 min | 15.5 | 13.2 | ||
Game Log - Shooting
| Date | Opponent | Score | gs | min | fg | pct | 3pt | pct | ft | pct | pts |
|---|---|---|---|---|---|---|---|---|---|---|---|
| Sep 23 | vs. TBD | - | - | - | - | - | - | - | - | - | |
| Sep 24 | vs. TBD | - | - | - | - | - | - | - | - | - | |
| Nov 4 | at LA Harbor | W, 77-66 | 1 | 35 | 8-11 | 72.7 | 0-0 | - | 14-23 | 60.9 | 30 |
| Nov 6 | Chabot | L, 83-61 | 1 | 27 | 5-10 | 50.0 | 0-0 | - | 5-7 | 71.4 | 15 |
| Nov 9 | Skyline | W, 54-51 | 1 | 34 | 7-17 | 41.2 | 0-0 | - | 4-5 | 80.0 | 18 |
| Nov 17 | at Palomar | L, 63-46 | 1 | 25 | 2-7 | 28.6 | 0-0 | - | 8-13 | 61.5 | 12 |
| Nov 18 | vs. Mt. San Jacinto | L, 64-52 | 1 | 37 | 4-12 | 33.3 | 0-0 | - | 2-6 | 33.3 | 10 |
| Nov 21 | at Reedley | W, 71-68 | 1 | 33 | 6-18 | 33.3 | 1-1 | 100.0 | 5-13 | 38.5 | 18 |
| Nov 30 | Cerritos | W, 60-48 | 1 | 37 | 6-10 | 60.0 | 0-0 | - | 3-6 | 50.0 | 15 |
| Dec 1 | Folsom Lake | L, 73-60 | 1 | 33 | 3-11 | 27.3 | 0-0 | - | 1-4 | 25.0 | 7 |
| Dec 2 | Fresno | L, 80-62 | 1 | 34 | 5-12 | 41.7 | 0-0 | - | 7-12 | 58.3 | 17 |
| Dec 8 | Taft | L, 85-84 | 1 | 28 | 6-8 | 75.0 | 0-0 | - | 2-4 | 50.0 | 14 |
| Dec 9 | Chaffey | L, 90-85 | 1 | 45 | 7-17 | 41.2 | 0-0 | - | 7-12 | 58.3 | 21 |
| Dec 11 | Gavilan | W, 71-28 | 1 | 32 | 3-9 | 33.3 | 0-1 | 0.0 | 4-6 | 66.7 | 10 |
| Dec 21 | at Glendale | L, 63-46 | 1 | 34 | 3-8 | 37.5 | 0-0 | - | 2-3 | 66.7 | 8 |
| Dec 22 | vs. Cypress | W, 54-46 | 1 | 35 | 4-12 | 33.3 | 0-0 | - | 3-7 | 42.9 | 11 |
| Dec 29 | at Cabrillo | W, 74-44 | 1 | 31 | 2-3 | 66.7 | 0-0 | - | 1-2 | 50.0 | 5 |
| Dec 30 | at Hartnell | L, 87-68 | 1 | 32 | 4-9 | 44.4 | 0-0 | - | 6-8 | 75.0 | 14 |
| Jan 13 | at Oxnard | W, 62-30 | 1 | 28 | 4-12 | 33.3 | 0-0 | - | 3-5 | 60.0 | 11 |
| Jan 17 | Cuesta | W, 65-55 | 1 | 35 | 0-5 | 0.0 | 0-0 | - | 3-4 | 75.0 | 3 |
| Jan 20 | Moorpark | L, 57-43 | 1 | 32 | 2-9 | 22.2 | 0-0 | - | 2-2 | 100.0 | 6 |
| Jan 24 | at L.A. Pierce | W, 78-62 | 1 | 31 | 5-9 | 55.6 | 0-0 | - | 2-4 | 50.0 | 12 |
| Jan 27 | at Santa Barbara | W, 71-63 | 1 | 35 | 3-10 | 30.0 | 0-0 | - | 3-4 | 75.0 | 9 |
| Jan 31 | Ventura | L, 67-44 | 1 | 34 | 2-9 | 22.2 | 0-0 | - | 1-3 | 33.3 | 5 |
| Feb 7 | Oxnard | W, 90-53 | 1 | 27 | 4-8 | 50.0 | 0-0 | - | 2-4 | 50.0 | 10 |
| Feb 10 | at Cuesta | W, 75-68 | 1 | 33 | 7-13 | 53.8 | 0-0 | - | 4-4 | 100.0 | 18 |
| Feb 14 | at Moorpark | L, 74-58 | 1 | 31 | 7-13 | 53.8 | 0-0 | - | 3-6 | 50.0 | 17 |
| Feb 17 | L.A. Pierce | W, 83-80 | 1 | 38 | 4-11 | 36.4 | 0-0 | - | 7-9 | 77.8 | 15 |
| Feb 21 | Santa Barbara | W, 60-53 | 1 | 24 | 3-11 | 27.3 | 0-0 | - | 1-2 | 50.0 | 7 |
| Feb 23 | at Ventura | W, 56-42 | 1 | 37 | 6-12 | 50.0 | 0-2 | 0.0 | 2-4 | 50.0 | 14 |
| Feb 28 | at Antelope Valley | W, 75-63 | 1 | 35 | 6-12 | 50.0 | 0-0 | - | 2-4 | 50.0 | 14 |
| Mar 2 | at Moorpark | L, 75-52 | 1 | 32 | 6-12 | 50.0 | 0-0 | - | 4-8 | 50.0 | 16 |
Game Log - Ball control
| Date | Opponent | Score | gs | min | off | def | reb | ast | to | a/to | stl | blk | pf | dq |
|---|---|---|---|---|---|---|---|---|---|---|---|---|---|---|
| Sep 23 | vs. TBD | - | - | - | - | - | - | - | - | - | - | - | - | |
| Sep 24 | vs. TBD | - | - | - | - | - | - | - | - | - | - | - | - | |
| Nov 4 | at LA Harbor | W, 77-66 | 1 | 35 | 2 | 5 | 7 | 2 | 3 | 0.7 | 4 | 0 | 2 | - |
| Nov 6 | Chabot | L, 83-61 | 1 | 27 | 1 | 4 | 5 | 0 | 1 | 0.0 | 1 | 0 | 5 | 1 |
| Nov 9 | Skyline | W, 54-51 | 1 | 34 | 7 | 6 | 13 | 2 | 4 | 0.5 | 2 | 0 | 3 | - |
| Nov 17 | at Palomar | L, 63-46 | 1 | 25 | 3 | 3 | 6 | 1 | 3 | 0.3 | 0 | 0 | 4 | - |
| Nov 18 | vs. Mt. San Jacinto | L, 64-52 | 1 | 37 | 2 | 5 | 7 | 0 | 2 | 0.0 | 1 | 0 | 3 | - |
| Nov 21 | at Reedley | W, 71-68 | 1 | 33 | 2 | 3 | 5 | 2 | 4 | 0.5 | 1 | 1 | 3 | - |
| Nov 30 | Cerritos | W, 60-48 | 1 | 37 | 5 | 10 | 15 | 0 | 4 | 0.0 | 0 | 0 | 2 | - |
| Dec 1 | Folsom Lake | L, 73-60 | 1 | 33 | 2 | 2 | 4 | 0 | 0 | - | 0 | 0 | 2 | - |
| Dec 2 | Fresno | L, 80-62 | 1 | 34 | 1 | 7 | 8 | 0 | 5 | 0.0 | 3 | 0 | 3 | - |
| Dec 8 | Taft | L, 85-84 | 1 | 28 | 1 | 5 | 6 | 0 | 3 | 0.0 | 0 | 0 | 3 | - |
| Dec 9 | Chaffey | L, 90-85 | 1 | 45 | 3 | 5 | 8 | 0 | 6 | 0.0 | 2 | 0 | 1 | - |
| Dec 11 | Gavilan | W, 71-28 | 1 | 32 | 5 | 7 | 12 | 1 | 3 | 0.3 | 2 | 0 | 1 | - |
| Dec 21 | at Glendale | L, 63-46 | 1 | 34 | 3 | 1 | 4 | 0 | 4 | 0.0 | 1 | 0 | 0 | - |
| Dec 22 | vs. Cypress | W, 54-46 | 1 | 35 | 3 | 11 | 14 | 3 | 0 | - | 1 | 1 | 2 | - |
| Dec 29 | at Cabrillo | W, 74-44 | 1 | 31 | 3 | 7 | 10 | 1 | 3 | 0.3 | 1 | 0 | 0 | - |
| Dec 30 | at Hartnell | L, 87-68 | 1 | 32 | 3 | 7 | 10 | 1 | 3 | 0.3 | 1 | 0 | 0 | - |
| Jan 13 | at Oxnard | W, 62-30 | 1 | 28 | 8 | 4 | 12 | 1 | 3 | 0.3 | 0 | 0 | 2 | - |
| Jan 17 | Cuesta | W, 65-55 | 1 | 35 | 5 | 6 | 11 | 1 | 5 | 0.2 | 1 | 0 | 1 | - |
| Jan 20 | Moorpark | L, 57-43 | 1 | 32 | 1 | 8 | 9 | 3 | 2 | 1.5 | 0 | 1 | 3 | - |
| Jan 24 | at L.A. Pierce | W, 78-62 | 1 | 31 | 3 | 6 | 9 | 2 | 1 | 2.0 | 3 | 0 | 1 | - |
| Jan 27 | at Santa Barbara | W, 71-63 | 1 | 35 | 4 | 1 | 5 | 2 | 0 | - | 0 | 0 | 3 | - |
| Jan 31 | Ventura | L, 67-44 | 1 | 34 | 1 | 4 | 5 | 0 | 2 | 0.0 | 2 | 1 | 3 | - |
| Feb 7 | Oxnard | W, 90-53 | 1 | 27 | 5 | 7 | 12 | 2 | 1 | 2.0 | 2 | 0 | 4 | - |
| Feb 10 | at Cuesta | W, 75-68 | 1 | 33 | 4 | 3 | 7 | 0 | 5 | 0.0 | 2 | 0 | 3 | - |
| Feb 14 | at Moorpark | L, 74-58 | 1 | 31 | 3 | 6 | 9 | 1 | 3 | 0.3 | 0 | 0 | 3 | - |
| Feb 17 | L.A. Pierce | W, 83-80 | 1 | 38 | 4 | 4 | 8 | 0 | 2 | 0.0 | 2 | 0 | 2 | - |
| Feb 21 | Santa Barbara | W, 60-53 | 1 | 24 | 5 | 4 | 9 | 1 | 2 | 0.5 | 1 | 0 | 4 | - |
| Feb 23 | at Ventura | W, 56-42 | 1 | 37 | 3 | 6 | 9 | 2 | 2 | 1.0 | 0 | 0 | 0 | - |
| Feb 28 | at Antelope Valley | W, 75-63 | 1 | 35 | 6 | 5 | 11 | 2 | 3 | 0.7 | 6 | 0 | 3 | - |
| Mar 2 | at Moorpark | L, 75-52 | 1 | 32 | 1 | 3 | 4 | 2 | 1 | 2.0 | 1 | 0 | 1 | - |
Splits Stats - Shooting per game
| gp | gs | min/g | fg/g | pct | 3pt/g | pct | ft/g | pct | ppg | ||
|---|---|---|---|---|---|---|---|---|---|---|---|
| Event | Total | 30 | 30 | 32.8 | 4.5-10.7 | 41.9 | 0.0-0.1 | 25.0 | 3.8-6.5 | 58.2 | 12.7 |
| Conference | 12 | 12 | 32.1 | 3.9-10.2 | 38.5 | 0.0-0.2 | 0.0 | 2.8-4.2 | 64.7 | 10.6 | |
| Exhibition | - | - | - | 0.0-0.0 | - | 0.0-0.0 | - | 0.0-0.0 | - | - | |
| Location | Home | 14 | 14 | 32.9 | 4.1-10.5 | 38.8 | 0.0-0.1 | 0.0 | 3.5-5.7 | 61.3 | 11.6 |
| Away | 14 | 14 | 32.3 | 4.9-10.6 | 46.3 | 0.1-0.2 | 33.3 | 4.2-7.2 | 58.4 | 14.1 | |
| Neutral | 2 | 2 | 36.0 | 4.0-12.0 | 33.3 | 0.0-0.0 | - | 2.5-6.5 | 38.5 | 10.5 | |
| Result | Wins | 17 | 17 | 32.9 | 4.6-10.8 | 42.6 | 0.1-0.2 | 25.0 | 3.7-6.2 | 59.4 | 12.9 |
| Losses | 13 | 13 | 32.6 | 4.3-10.5 | 40.9 | 0.0-0.0 | - | 3.8-6.8 | 56.8 | 12.5 | |
| Month | November | 7 | 7 | 32.6 | 5.4-12.1 | 44.7 | 0.1-0.1 | 100.0 | 5.9-10.4 | 56.2 | 16.9 |
| December | 9 | 9 | 33.8 | 4.1-9.9 | 41.6 | 0.0-0.1 | 0.0 | 3.7-6.4 | 56.9 | 11.9 | |
| January | 6 | 6 | 32.5 | 2.7-9.0 | 29.6 | 0.0-0.0 | - | 2.3-3.7 | 63.6 | 7.7 | |
| February | 7 | 7 | 32.1 | 5.3-11.4 | 46.3 | 0.0-0.3 | 0.0 | 3.0-4.7 | 63.6 | 13.6 | |
| March | 1 | 1 | 32.0 | 6.0-12.0 | 50.0 | 0.0-0.0 | - | 4.0-8.0 | 50.0 | 16.0 |
Splits Stats - Shooting totals
| gp | gs | min | fg | pct | 3pt | pct | ft | pct | pts | ||
|---|---|---|---|---|---|---|---|---|---|---|---|
| Event | Total | 30 | 30 | 984 | 134-320 | 41.9 | 1-4 | 25.0 | 113-194 | 58.2 | 382 |
| Conference | 12 | 12 | 385 | 47-122 | 38.5 | 0-2 | 0.0 | 33-51 | 64.7 | 127 | |
| Exhibition | - | - | - | 0-0 | - | 0-0 | - | 0-0 | - | 0 | |
| Location | Home | 14 | 14 | 460 | 57-147 | 38.8 | 0-1 | 0.0 | 49-80 | 61.3 | 163 |
| Away | 14 | 14 | 452 | 69-149 | 46.3 | 1-3 | 33.3 | 59-101 | 58.4 | 198 | |
| Neutral | 2 | 2 | 72 | 8-24 | 33.3 | 0-0 | - | 5-13 | 38.5 | 21 | |
| Result | Wins | 17 | 17 | 560 | 78-183 | 42.6 | 1-4 | 25.0 | 63-106 | 59.4 | 220 |
| Losses | 13 | 13 | 424 | 56-137 | 40.9 | 0-0 | - | 50-88 | 56.8 | 162 | |
| Month | November | 7 | 7 | 228 | 38-85 | 44.7 | 1-1 | 100.0 | 41-73 | 56.2 | 118 |
| December | 9 | 9 | 304 | 37-89 | 41.6 | 0-1 | 0.0 | 33-58 | 56.9 | 107 | |
| January | 6 | 6 | 195 | 16-54 | 29.6 | 0-0 | - | 14-22 | 63.6 | 46 | |
| February | 7 | 7 | 225 | 37-80 | 46.3 | 0-2 | 0.0 | 21-33 | 63.6 | 95 | |
| March | 1 | 1 | 32 | 6-12 | 50.0 | 0-0 | - | 4-8 | 50.0 | 16 |
Splits Stats - Shooting per 40 min
| gp | gs | min/g | fg/40 | pct | 3pt/40 | pct | ft/40 | pct | pts/40 | ||
|---|---|---|---|---|---|---|---|---|---|---|---|
| Event | Total | 30 | 30 | 32.8 | 5.4-13.0 | 41.9 | 0.0-0.2 | 25.0 | 4.6-7.9 | 58.2 | 15.5 |
| Conference | 12 | 12 | 32.1 | 4.9-12.7 | 38.5 | 0.0-0.2 | 0.0 | 3.4-5.3 | 64.7 | 13.2 | |
| Exhibition | - | - | - | 0.0-0.0 | - | 0.0-0.0 | - | 0.0-0.0 | - | - | |
| Location | Home | 14 | 14 | 32.9 | 5.0-12.8 | 38.8 | 0.0-0.1 | 0.0 | 4.3-7.0 | 61.3 | 14.2 |
| Away | 14 | 14 | 32.3 | 6.1-13.2 | 46.3 | 0.1-0.3 | 33.3 | 5.2-8.9 | 58.4 | 17.5 | |
| Neutral | 2 | 2 | 36.0 | 4.4-13.3 | 33.3 | 0.0-0.0 | - | 2.8-7.2 | 38.5 | 11.7 | |
| Result | Wins | 17 | 17 | 32.9 | 5.6-13.1 | 42.6 | 0.1-0.3 | 25.0 | 4.5-7.6 | 59.4 | 15.7 |
| Losses | 13 | 13 | 32.6 | 5.3-12.9 | 40.9 | 0.0-0.0 | - | 4.7-8.3 | 56.8 | 15.3 | |
| Month | November | 7 | 7 | 32.6 | 6.7-14.9 | 44.7 | 0.2-0.2 | 100.0 | 7.2-12.8 | 56.2 | 20.7 |
| December | 9 | 9 | 33.8 | 4.9-11.7 | 41.6 | 0.0-0.1 | 0.0 | 4.3-7.6 | 56.9 | 14.1 | |
| January | 6 | 6 | 32.5 | 3.3-11.1 | 29.6 | 0.0-0.0 | - | 2.9-4.5 | 63.6 | 9.4 | |
| February | 7 | 7 | 32.1 | 6.6-14.2 | 46.3 | 0.0-0.4 | 0.0 | 3.7-5.9 | 63.6 | 16.9 | |
| March | 1 | 1 | 32.0 | 7.5-15.0 | 50.0 | 0.0-0.0 | - | 5.0-10.0 | 50.0 | 20.0 |
Splits Stats - Ball control per game
| gp | gs | mpg | off/g | def/g | reb/g | pf/g | dq/g | ast/g | to/g | a/to | stl/g | blk/g | ||
|---|---|---|---|---|---|---|---|---|---|---|---|---|---|---|
| Event | Total | 30 | 30 | 32.8 | 3.3 | 5.2 | 8.5 | 2.2 | 0.0 | 1.1 | 2.7 | 0.4 | 1.3 | 0.1 |
| Conference | 12 | 12 | 32.1 | 3.8 | 4.9 | 8.8 | 2.4 | - | 1.3 | 2.3 | 0.5 | 1.1 | 0.2 | |
| Exhibition | - | - | - | - | - | - | - | - | - | - | - | - | - | |
| Location | Home | 14 | 14 | 32.9 | 3.3 | 5.6 | 8.9 | 2.6 | 0.1 | 0.7 | 2.9 | 0.3 | 1.3 | 0.1 |
| Away | 14 | 14 | 32.3 | 3.4 | 4.3 | 7.7 | 1.8 | - | 1.4 | 2.7 | 0.5 | 1.4 | 0.1 | |
| Neutral | 2 | 2 | 36.0 | 2.5 | 8.0 | 10.5 | 2.5 | - | 1.5 | 1.0 | 1.5 | 1.0 | 0.5 | |
| Result | Wins | 17 | 17 | 32.9 | 4.4 | 5.6 | 9.9 | 2.1 | - | 1.4 | 2.6 | 0.5 | 1.6 | 0.1 |
| Losses | 13 | 13 | 32.6 | 1.9 | 4.6 | 6.5 | 2.4 | 0.1 | 0.6 | 2.7 | 0.2 | 0.9 | 0.2 | |
| Month | November | 7 | 7 | 32.6 | 3.1 | 5.1 | 8.3 | 3.1 | 0.1 | 1.0 | 3.0 | 0.3 | 1.3 | 0.1 |
| December | 9 | 9 | 33.8 | 2.7 | 5.8 | 8.4 | 1.3 | - | 0.7 | 3.0 | 0.2 | 1.2 | 0.1 | |
| January | 6 | 6 | 32.5 | 3.7 | 4.8 | 8.5 | 2.2 | - | 1.5 | 2.2 | 0.7 | 1.0 | 0.3 | |
| February | 7 | 7 | 32.1 | 4.3 | 5.0 | 9.3 | 2.7 | - | 1.1 | 2.6 | 0.4 | 1.9 | 0.0 | |
| March | 1 | 1 | 32.0 | 1.0 | 3.0 | 4.0 | 1.0 | - | 2.0 | 1.0 | 2.0 | 1.0 | 0.0 |
Splits Stats - Ball control totals
| gp | gs | min | off | def | reb | pf | dq | ast | to | a/to | stl | blk | ||
|---|---|---|---|---|---|---|---|---|---|---|---|---|---|---|
| Event | Total | 30 | 30 | 984 | 99 | 155 | 254 | 67 | 1 | 32 | 80 | 0.4 | 40 | 4 |
| Conference | 12 | 12 | 385 | 46 | 59 | 105 | 29 | - | 15 | 28 | 0.5 | 13 | 2 | |
| Exhibition | - | - | - | - | - | - | - | - | - | - | - | - | - | |
| Location | Home | 14 | 14 | 460 | 46 | 79 | 125 | 37 | 1 | 10 | 40 | 0.3 | 18 | 2 |
| Away | 14 | 14 | 452 | 48 | 60 | 108 | 25 | - | 19 | 38 | 0.5 | 20 | 1 | |
| Neutral | 2 | 2 | 72 | 5 | 16 | 21 | 5 | - | 3 | 2 | 1.5 | 2 | 1 | |
| Result | Wins | 17 | 17 | 560 | 74 | 95 | 169 | 36 | - | 24 | 45 | 0.5 | 28 | 2 |
| Losses | 13 | 13 | 424 | 25 | 60 | 85 | 31 | 1 | 8 | 35 | 0.2 | 12 | 2 | |
| Month | November | 7 | 7 | 228 | 22 | 36 | 58 | 22 | 1 | 7 | 21 | 0.3 | 9 | 1 |
| December | 9 | 9 | 304 | 24 | 52 | 76 | 12 | - | 6 | 27 | 0.2 | 11 | 1 | |
| January | 6 | 6 | 195 | 22 | 29 | 51 | 13 | - | 9 | 13 | 0.7 | 6 | 2 | |
| February | 7 | 7 | 225 | 30 | 35 | 65 | 19 | - | 8 | 18 | 0.4 | 13 | 0 | |
| March | 1 | 1 | 32 | 1 | 3 | 4 | 1 | - | 2 | 1 | 2.0 | 1 | 0 |
Splits Stats - Ball control per 40 min
| gp | gs | mpg | off/40 | def/40 | reb/40 | pf/40 | dq/40 | ast/40 | to/40 | a/to | stl/40 | blk/40 | ||
|---|---|---|---|---|---|---|---|---|---|---|---|---|---|---|
| Event | Total | 30 | 30 | 32.8 | 4.0 | 6.3 | 10.3 | 2.7 | 0.0 | 1.3 | 3.3 | 0.4 | 1.6 | 0.2 |
| Conference | 12 | 12 | 32.1 | 4.8 | 6.1 | 10.9 | 3.0 | 0.0 | 1.6 | 2.9 | 0.5 | 1.4 | 0.2 | |
| Exhibition | - | - | - | - | - | - | - | - | - | - | - | - | - | |
| Location | Home | 14 | 14 | 32.9 | 4.0 | 6.9 | 10.9 | 3.2 | 0.1 | 0.9 | 3.5 | 0.3 | 1.6 | 0.2 |
| Away | 14 | 14 | 32.3 | 4.2 | 5.3 | 9.6 | 2.2 | 0.0 | 1.7 | 3.4 | 0.5 | 1.8 | 0.1 | |
| Neutral | 2 | 2 | 36.0 | 2.8 | 8.9 | 11.7 | 2.8 | 0.0 | 1.7 | 1.1 | 1.5 | 1.1 | 0.6 | |
| Result | Wins | 17 | 17 | 32.9 | 5.3 | 6.8 | 12.1 | 2.6 | 0.0 | 1.7 | 3.2 | 0.5 | 2.0 | 0.1 |
| Losses | 13 | 13 | 32.6 | 2.4 | 5.7 | 8.0 | 2.9 | 0.1 | 0.8 | 3.3 | 0.2 | 1.1 | 0.2 | |
| Month | November | 7 | 7 | 32.6 | 3.9 | 6.3 | 10.2 | 3.9 | 0.2 | 1.2 | 3.7 | 0.3 | 1.6 | 0.2 |
| December | 9 | 9 | 33.8 | 3.2 | 6.8 | 10.0 | 1.6 | 0.0 | 0.8 | 3.6 | 0.2 | 1.4 | 0.1 | |
| January | 6 | 6 | 32.5 | 4.5 | 5.9 | 10.5 | 2.7 | 0.0 | 1.8 | 2.7 | 0.7 | 1.2 | 0.4 | |
| February | 7 | 7 | 32.1 | 5.3 | 6.2 | 11.6 | 3.4 | 0.0 | 1.4 | 3.2 | 0.4 | 2.3 | 0.0 | |
| March | 1 | 1 | 32.0 | 1.3 | 3.8 | 5.0 | 1.3 | 0.0 | 2.5 | 1.3 | 2.0 | 1.3 | 0.0 |
News Mentions
No. 18 Women's Basketball Defeats No. 15 AVC, Advances to Second Round
February 29, 2024

Women's Basketball Secures Playoff Spot after Upset at Ventura
February 26, 2024
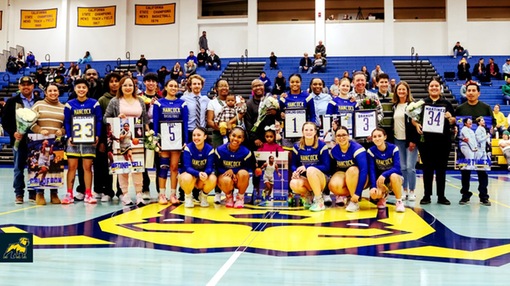
Women's Basketball Outlasts SBCC in Sophomore Night Win, 60-53
February 22, 2024
Women's Basketball: Bulldogs Complete Sweep at Cuesta, 75-68
February 13, 2024
Women's Basketball Grounds Condors, 90-53
February 8, 2024
Women's Basketball Bounces Back with Win over LA Pierce
January 25, 2024
Women's Basketball: Bulldogs Sputter Against Moorpark in 57-43 Loss
January 22, 2024
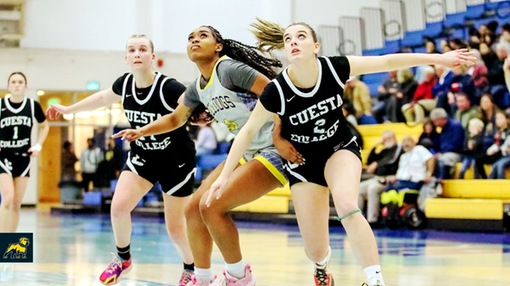
Women's Basketball Overcomes Early Deficit to Top Cuesta, 65-55
January 18, 2024
Women's Basketball Thumps Gavilan, 71-28
December 12, 2023
Women's Basketball Falls Twice in Heartbreaking Fashion at AHC Crossover
December 11, 2023
Women's Basketball: Bulldogs Bounce Back with Win over Skyline
November 13, 2023
Women's Basketball Opens Season with Win at LA Harbor
November 6, 2023

Photos